EPA Releases Fuel Economy and Greenhouse Gas Reports
The Environmental Protection Agency (EPA) recently released its new “Light-Duty Automotive Technology, Carbon Dioxide Emissions, and Fuel Economy Trends” report, showing that average fuel economy of new vehicles increased 0.1 miles per gallon from model-year 2015 to model-year 2016. According to the American Council for an Energy-Efficient Economy, an extra mile per gallon would have saved drivers $13 billion in 2017.
In addition, the “Manufacturer Performance Report” showed that automakers stayed in compliance with greenhouse gas emissions standards, despite the small increase in average miles per gallon, by spending some of the credits they’d accumulated through over-compliance in prior years: the industry spent 11 percent of available credits to comply with model-year 2016 greenhouse gas standards.
Esri Releases Complete Utility GIS Platform
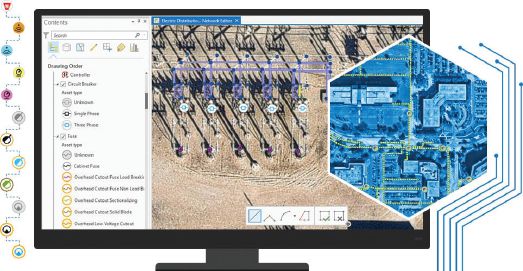
GIS software company Esri established further inroads into the infrastructure market, releasing advanced network capabilities for utilities as part of its ArcGIS platform. The ArcGIS Utility Network Management extension, which delivers the new utility network, lets users create, manage and share complete data about networks from source to demand, such as residential meters for electric, water, wastewater, gas, district heating and telecommunications companies.
Workers now can edit and trace the path of a network from a smart device while in the field and share information securely and more easily with those who need it. Previously, each utility subnetwork (e.g., transmission lines, substations, low-voltage networks, etc.) had its own separate GIS database.
National Transit Database Provides Key Stats on U.S. Public Transportation
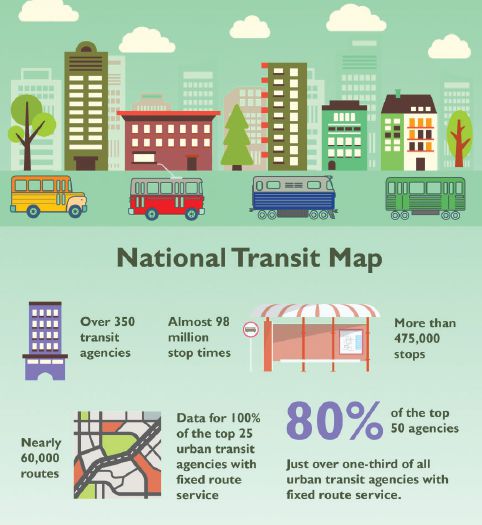
Did you know that Americans took 10.2 billion trips on public transportation in 2016, and that transit ridership increased 26 percent during the last 20 years?
These facts come from the National Transit Database (NTD), a trove of statistics and information about public transportation in the United States. Established by Congress in 1974, the NTD is the nation’s primary source of publicly available data on transit systems across the country. The Federal Transit Administration (FTA) manages the NTD and uses the data to allocate federal funds. In addition to FTA, a variety of groups and individuals use the database, including state and local governments, researchers and students, the media, and industry associations.
The accompanying National Transit Map graphic highlights some key statistics. For more information and current data, visit the FTA website at www.transit.dot.gov/ntd.
TOP Stories
The following are the top stories from the last few months (in terms of traffic) on the Informed Infrastructure website. This also reflects key coverage areas that are regularly refreshed online and via our weekly e-newsletter. Simply search key words on Informed Infrastructure online to find the full story.
Buildings
• Researchers Develop Earthquake-Resistant Concrete
• CINTEC North America Announces Restoration of the Historic Simpson Tower in Toronto
• Ancient Construction Serves as Model for Today’s Earthquake-Safe Buildings
• Siemens Establishes Americas Digital Service Center to Help Transform Building Technologies Industry
• Steel Industry Releases Guide to LEED v4 Certification
Transportation
• $8M in Funding Available for Transportation Alternatives Program Involving Walking, Biking
• Ready To Build: Susquehanna River Bridge
• Seven Students Take Top Honors in Annual Video Contest on America’s Transportation Infrastructure
• A Digital Twin to Make Amsterdam’s 3D-Printed Steel Bridge Smarter and Safer
• The New Trend that’s Lighting Up Awards Season in Transportation
Water
• Cost-Effective, Chemical-Free Biological Sewage Treatment for Marine Applications
• US$9.5 Billion City Water Projects Open for Investment
• State Water Utility Takes Aim at Water Infrastructure Education
• Canadian Contaminated Site Counts on New Storm Water System
Tools and Technology
• Siemens Establishes Americas Digital Service Center to Help Transform Building Technologies Industry
• Augmented Reality Transport Intelligence Visualisation Demonstrated in Queensland
• Bentley Systems and Topcon Collaborate for Constructioneering Academy Initiative
• Baum Introduces PowerBaum, Industry’s Fastest Power Analysis and Modeling Solution
ACI Releases World Airport Traffic Forecasts
Airports Council International (ACI) released the latest edition of the “World Airport Traffic Forecasts (WATF) 2016-2040,” which presents aggregate airport traffic projections at global, regional and country levels based on internationally comparable airport traffic data. Absolute figures and compounded annual growth rates are presented through short-, medium- and long-term time horizons. Global traffic surpassed the 7 billion passenger mark in 2015 and is expected to double by 2029 based on a projected growth rate of 5.2 percent per annum.
“Because infrastructure projects are costly and often disruptive, a data-driven understanding of future demand—such as the expected number of aircraft movements, passenger traffic throughput and air cargo volumes—gives airport planners and investors the necessary information for effective decision making,” said Angela Gittens, director general of ACI World.

Parul Dubey
Stormwater Interview with Robert Page, P.E., Vice President, HNTB
TriMet’s Banfield Type 1 Substation Replacement Project

February Issue 2026